My chapter in: SDG16 Data Initiative. Global Report 2020, New York, 32-37
The UN Member States have set ten specific targets for Sustainable Development Goal (SDG) 16 , the promotion of just, peaceful and inclusive societies. Of these targets, target 16.7 aims at ensuring “responsive, inclusive, participatory and representative decision-making at all levels”. Among the 17 SDGs and the 169 targets defined to achieve the Goals, target 16.7 may be viewed as a key target because it focuses on political decision-making, which is a crucial prerequisite for all of the desirable policy outcomes defined in SDG 16 and in the other SDGs. This chapter discusses the official indicators for monitoring target 16.7 and argues that the Global State of Democracy Indices – a set of democracy measures developed by the International Institute for Democracy and Electoral Assistance (International IDEA) – can function as valid proxy indicators.
The UN Statistical Commission has selected two indicators, or more precisely: sets of indicators to measure progress on target 16.7. The first set measures the extent to which the proportional representation of various demographic groups in (a) the legislature, (b) public service, and (c) the judiciary corresponds to national distributions of the same groups. This is captured in indicators 16.7.1a-c.
The second indicator set measures the proportion of people who (1) believe that they have a say in what the government does and (2) feel that the political system allows them to have an influence on politics. This is captured in indicator 16.7.2. Both indicator sets are to be disaggregated by sex, age, disability status, population groups and levels of government.
According to the metadata sheet prepared by the UN Statistics Division, the choice of indicators 16.7.1 a-c is based on the assumption that when parliament, public services and the judiciary reflect “the social diversity of a nation, this may lead to greater legitimacy [of these institutions] in the eyes of citizens,” as their “members resemble the people they represent in respect to gender, age, ethnicity and disability.”[1] As such, this indicator set is intended to measure representative and inclusive decision-making. In contrast, the second indicator set (16.7.2) is intended to capture participatory and responsive decision-making through public opinion surveys. Its underlying assumption is that both attributes are realized if the surveyed citizens believe they can impact politics.
Indicators 16.7.1 and 16.7.2 reflect the consensus of the Statistical Commission, but they also need to be publicly perceived as sufficiently valid measures for the concepts of “responsive, inclusive, participatory and representative decision-making”. One likely concern about their validity originates from the link between representation and democratic elections that has shaped notions of representation in democratic thought. Democratic theories assume that legislatures are representative if their members are elected by the citizens.
If citizens can participate with equal political rights in elections and decide freely between different candidates, the composition of the legislature is assumed to represent the aggregate political preferences of the population. This widespread notion of representation views free, fair and competitive legislative elections as a necessary element of a representative legislature.
Necessity implies that elections violating the aforementioned democratic standards would not lead to a legislature that represents the will of the population, even if it is representative in demographic terms. Thus, this reasoning would conclude that information on the proportions of various demographic groups in the legislature does not allow for sufficiently assessing the quality of the process followed to elect a representative legislature.
Another concern relates to the wording of the survey questions used to assess participatory and responsive decision-making. According to the definition of the first survey question provided in the metadata, “‘having a say in what the government does’ means having a channel to express one’s demands, opinions or preferences about what the government does, and feeling listened to.”[2] This definition points to ambiguities inherent to the idiom “having a say”. Survey participants may understand the question in a minimalist sense of “feeling that the government is listening.” Alternatively, respondents may conceive the question in a maximalist sense of “being empowered to participate in public policy-making.” What it means to “have a say” is likely to vary across countries, time and respondents’ sociocultural or socioeconomic backgrounds. Harmonized sampling techniques can reduce respondent-level biases but are not able to control for national cultural contexts guiding survey responses.
In addition to these conceptual concerns, there are also issues with the availability of data for the official 16.7 indicators. As of June 2020, the two official indicators for target 16.7 had not yet been available in the database of SDG indicators created by the UN Department of Economic and Social Affairs. Data on the proportions of female and younger legislators are collected by the Inter-Parliamentary Union (IPU) for a large number of countries, but the IPU’s new Parline database does not cover all UN Member States or extend back in time for age-disaggregated numbers of deputies. IPU has decided not to collect data on the disability and population group status of deputies, and instead plans to monitor legal provisions on the representation of these groups. International datasets on the proportions of demographic groups in public service and the judiciary are not available either. The two survey questions intended to assess participatory and responsive decision-making have so far been asked only in the European Social Survey covering 29 European countries. An OECD survey and the World Values Survey Association have asked the first survey question for a limited number of additional countries. Even if future surveys will cover more countries, they will not contain historical data points that would be needed to assess trends and developments within countries for a number of years.
To provide data, significant funding will be required to conduct opinion surveys and collect administrative data with a global coverage. In its Cape Town Global Action Plan adopted in 2017, the Statistical Commission has provided a road map for the modernization and strengthening of statistical systems. According to the UN’s SDG Report 2019, 129 countries worldwide had implemented a national statistical plan by 2018. However, in sub-Saharan Africa, only 23 per cent of plans were fully funded, although donor support for statistical capacity-building had increased by $400 million globally from 2006 to 2016.[3]
Given these concerns, it is necessary to re-evaluate trade-offs in the choice of official indicators selected to measure target 16.7. The Statistical Commission has refrained from relying on expert assessments to measure SDGs, which may be attributed to a skepticism regarding the validity and reliability of such assessments (see, for example, the Praia City Group’s Handbook on Governance Statistics[4]). Such concerns may, however, also be raised for mass survey and observational data, as illustrated by the above-mentioned examples. In other words, these data types are not per se more valid than expert assessments. In contrast with observational data, both expert assessments and public opinion surveys allow to assess latent traits that are not directly measurable, but which are particularly relevant for the complex concepts of decision-making covered in target 16.7.
International IDEA has developed a set of indicators measuring these concepts — responsiveness, inclusion, participation and representation — as part of its Global State of Democracy Indices (GSoDI). These indicators are predominantly based on expert assessments, but IDEA’s methods of measurement and aggregation effectively address the validity and reliability issues associated with such assessments. Firstly, the GSoDI are based on 14 different source datasets, harnessing the combined observations of different data providers to reduce the influence of bias associated with individual sources. The most important data source is the Varieties of Democracy (V-Dem) survey, a large-scale scholarly democracy measurement project that relies on at least five different country experts per data point and uses advanced techniques of calibrating individual assessments in order to minimize subjectivity. As an inter-governmental organization, International IDEA is guided by rules and accountability procedures ensuring impartiality, independence and the highest quality standards in developing and maintaining the GSoDI.
Secondly, the GSoDI (like V-Dem) aggregates indicators through graded Item Response Theory models and Bayesian factor analyses — statistical models that assign greater weights to source indicators that are more correlated to the latent concepts measured, such as “representative government”. Moreover, these aggregation techniques generate standard errors that quantify the measurement precision, that is, the degree to which the underlying source indicators agree.[5]
Thirdly, the GSoDI are disaggregated into 4 attributes, 16 subattributes, 5 subcomponents and 119 indicators, facilitating a differentiated and focused assessment of SDG target 16.7. For example, to measure “representative” decision-making, it is possible to focus on electoral integrity, the effective oversight function of the legislature, the share of female legislators or the extent to which political power is distributed by social group, each as separate indicators.
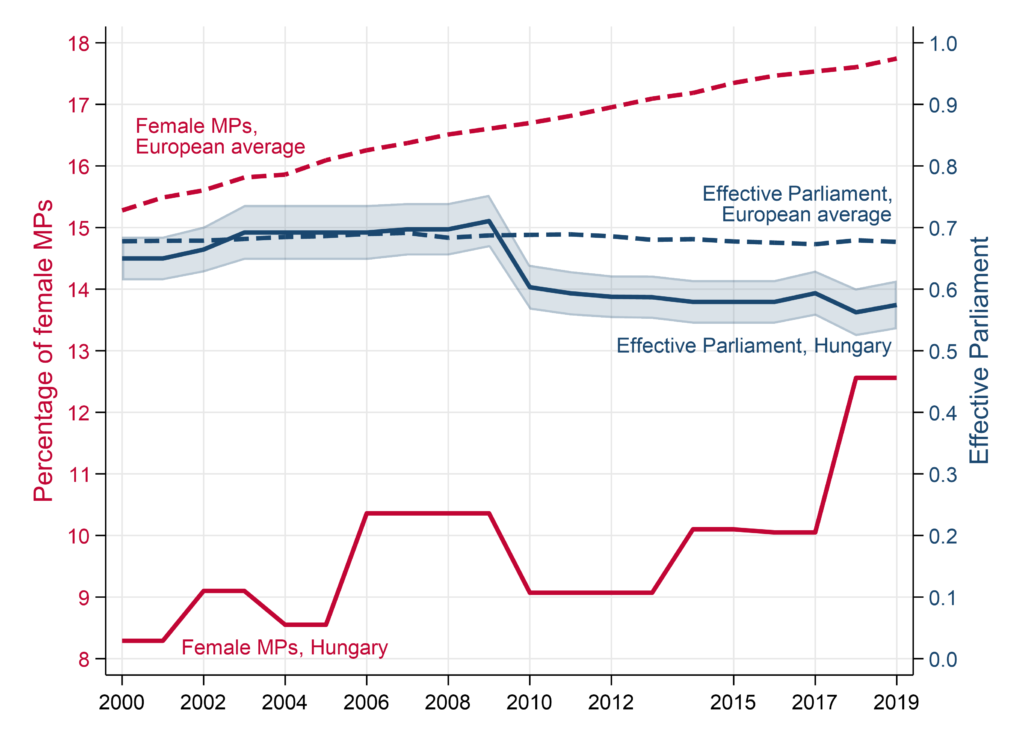
The graph below illustrates a more multi-faceted assessment of representative decision-making using the GSoDI indicators. The graph compares Hungary’s performance with the average of 42 European countries for two dimensions: (1) the share of female Members of Parliament (MPs) using IPU data, as envisaged by the official indicator; (2) the extent to which parliaments are capable of overseeing the executive (“Effective Parliament”). This measure is based on five indicators that monitor the extent to which parliament, in particular opposition MPs, question and investigate actions of the executive and can pose constraints on the decision-making powers of chief executives. The indicators are assessed by independent country experts selected by V-Dem and the Polity project, two renowned scholarly datasets.[6] The GSoDI aggregation method can be used to define 68%-confidence intervals that are shown for Hungary’s parliament as shaded areas in the graph.
The graph demonstrates Hungary performs below its regional peers with regards to gender representativeness, but tends to follow the European average with regard to trends over time. As for parliamentary oversight, the graph illustrates that Hungary has dropped below European average since 2010. This year marks the takeover of government by V. Orbán that has led to a widely observed deterioration of representative, inclusive and participatory decision-making in Hungary.
A key advantage of the GSoDI is that the Indices are not only available now and can be updated cost-efficiently, but also cover both 163 countries and 45 years (1975-2019). UN agencies, Member States conducting Voluntary National Reviews, non-governmental organizations, media outlets and citizens can access the dataset and create customized measures for their purposes. The GSoDI provide a retrospective view of changes over time that is not possible with the official indicators for target 16.7. However, viewing a country’s current situation in time will add to the validity of assessments since it enables policy-makers and the development community to compare with benchmark years in a country’s own history.
[1] UNSD: Metadata on Indicator 16.7.1.a, updated from 14/02/2020.
[2] UNSD: Metadata on Indicator 16.7.2, 7, Update from 6/01/2020.
[3] United Nations. 2019. Sustainable Development Goals Report 2019, United Nations (New York), 57.
[4] Praia City Group. 2019. Handbook on Governance Statistics, United Nations, 15.
[5] Skaaning, S.-E. 2019. The Global State of Democracy Indices Methodology. Conceptualization and Measurement Framework, Version 3., International Institute for Democracy and Electoral Assistance (Stockholm).
[6] Coppedge, M. (et al.) 2020. V-Dem [Country-Year/Country-Date] Dataset v10. Varieties of Democracy (V-Dem) Project (Gothenburg), https://doi.org/10.23696/vdemds20. Marshall, Monty G. / Gurr, Ted R. 2020. Polity5. Political Regime Characteristics and Transitions, 1800-2018, Center for Systemic Peace, www.systemicpeace.org.